K-D trees (K stands for the number of dimensions) are a spatial equivalent of the more familiar binary search trees, that usually have integer keys to facililtate efficient (log n) search). K-D trees belong to the class of spatial search tree structures, that include quadtrees, octrees, etc. These structures are used to represent geoemtrically defined spaces. In a 2 dimensional K-D tree (K = 2), we start with a 2D rectangular region and each step divides the space up into 2 regions using a partitioning line, that is usually axis-aligned (horizontal or vertical). This is done recursively, i.e., the subdivided regions are further subdivided until a certain termination criterion is satisfied. See the following figure that illustrates a 3 level partitioning:

Illustrates a 3-level K-D tree partitioning applied to a 2D region and teh resulting binary tree.
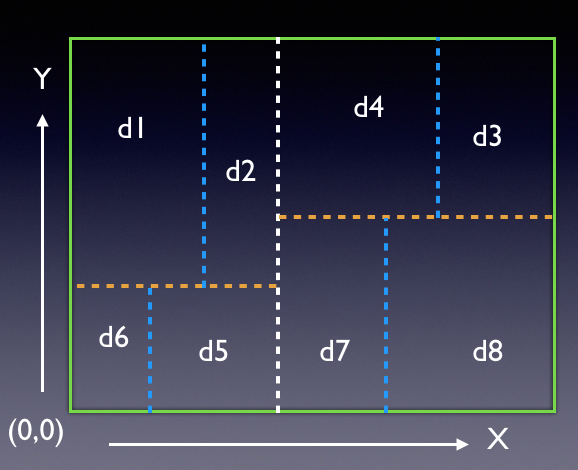
Illustrates a 2D region's partitioning with horizontal (X) and vertically (Y) oriented partitioners
In the figures above, a 2D region is being partitioned. The first partitioner is the white line that goes across the region, dividing it into two subregions (these become children of the root node of the tree. At the next level, the yellow lines partition the two subregions creating two of their own children each. Finally the blue lines subdivide at the third level. Each region can contain data (di s) that can be points or other information that can then be searched for efficiently knowing the location of the partitioning lines.
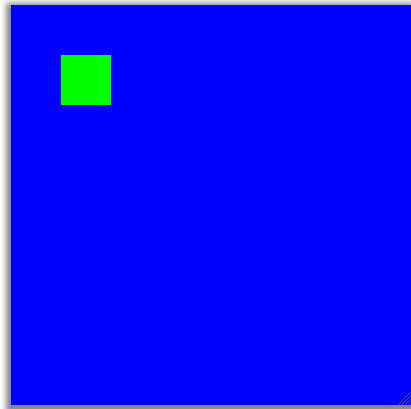
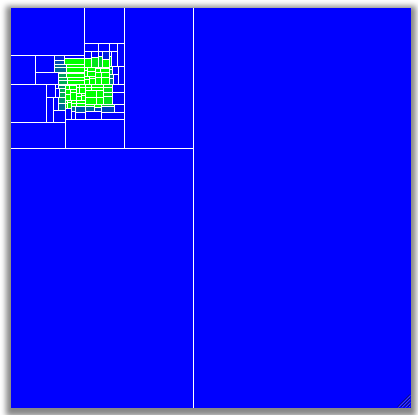
Application of K-D Trees to representing a shape. Here the green square (left image) is a simple shape being approximated by a 2D K-D tree representation. Note the adaptive partitioning, i.e., only regions near the cube boundary are partitioned, while the homogeneous (large blue) (or the interior cube) regions are not. Regions that are homogeneous are not partitioned and become leaf nodes of the tree.
The above figures contain a small green square inside a blue background. The left image is the
original image and the right image is a K-d Tree representation of the same image. The white lines
in the bottom image represent the partitioning lines. Notice that this representation is
approximate, since the image itself is represented by the leaf nodes (which are all
rectangles of varying size) of the tree. In other words, the K-D tree chops up the original
image rectangle into a set of smaller sized rectangular regions to represent the image.
The entire image is now represented by the tree with enough information (leaf nodes will have
the region geometry and its color) to generate the image.
Applications: Refer to the Wikipedia page on K-D trees for additional information and applications.
You will use the K-D TreeElement class structure as a subclass of the BinTreeElement defined in BRIDGES. You will use this structure along with the ColorGrid type to represent images using K-D Trees.
Preparation:
Now that you are comfortable with K-D Trees and Color grids, you are ready to implement this project. To represent images using the Kd Tree, we will use the ColorGrid structure in BRIDGES to hold an image. Sample images will be provided. The general idea of representing images using a spatial structure is to subdivide the image region adaptively, i.e., focusing higher amounts of subdivision in areas of more detail/complexity, so as to get a more accurate representation. You will develop this application in two stages:
Output: Your application will display (using BRIDGES) both the original images and the KD tree representation of the image (including the partitioning lines).
Testing: Test your implementation with various images, for instance, yourself, your pet or anything that personalizes this project for you. Play with the representation level (of the tree) and generate a series of images of increasing detail.
KdTreeElement<int, string> *buildImageTree (
	int *region,    // region - xmin, ymin, xmax, ymax
	int level,      // level of the tree, starts at 0 for root
	ColorGrid *cg   // the region - originally the entire image
	bool dim_flag) {// partitioning dimension, will flip with each
	// create a kd tree element
	KdTreeElement<int, int> *root = new KdTreeElement<int, int>(.....)

	// check the region's homogeneity
	bool homogeneous = IsRegionHomogeneous(....);

	if ((level < MaxLevel) && !homogeneous) {   // partition
		if (!dim_flag){
			// partition on X
			// choose a partioning value between xmin and xmax
			partition = partition(.... )

			// form the two partitioned regions, left and right
			int lregion[] = ...
			int rregion[] = ...

			// recurse
			root->setLeft(buildImageTree (.....);
			root->setRight(buildImageTree (.....);
		}
		else {
			// partition on Y
			// ditto... for partitioning on the Y dimension, similar to X but regions
			// will be bottom and top regions

		}
		// color the partitioning line, in white, so
		// we can see the adaptive kd tree partitioning of
		// the image first form the partitioned region,
		// depending on the partitioning dimension
		// treat it as a thin region of width 2 or 3 pixels, so
		// its clearly visible
		int partitioned_region[] = {.....}

		// color the region - similar to the color grid in Module 1
		ColorRegion ( ......, "white"...)

		return root;
	}
	// region is homogeenous, color it using the average
	// color of the region (compute avg in r, g, b separately
	ColorRegion (cg, region);

	return nullptr;
}
We need to be able to compute how homogeneous a region is before deciding to partition that region. You will write two versions of this function
IsRegionHomogeneous ()
which takes in a region (which is defined by a box - ranges in X and Y - within the image) and checks to see if the colors are homogeneous within a threshold. Consider the following 2 strategies:
In this simpler version (works only on 2 color images), you simply have to see if there are two pixels of different colors to determine a region to be not homogeneous, else it is homogeneous. Terminate if you find the region heterogenous and continue with the partitioning
Use the following algorithm: first sum the colors (for each of the red, green and blue components) and compute the average red, blue and green colors for the region. Next iterate through the region's pixels and compare each R, G, B value to the average. If any of the differences are above a set threshold, then the region is not homogeneous and return false, else return true.
Max levels: Notice that there is a constant called Max_Levels - this is used to limit amount of partitioning (height of the KD tree). The level variable should be incremented when you recurse and the recursion will terminate if the max levels is reached.
Partitioner: Write a function that will return a partitioning value between the region's
min and max values in that dimension. For instance, the region's X values are within
10 to 50, then pick a value between the two at random; to avoid very thin regions,
pick a value between first and the second third (between (10+40/3, 50-40/3). If the region
width (max-min) is less than 3, then return true (homogeneous) to avoid degenerate cases).
Note that we are using the ColorGrid type to fill the image with the region colors (r, g and b), so that we can visualize it with BRIDGES. Follow the Colorgrid tutorials for filling in regions with the computed colors (as required by the ColorRegion() function above).
The project can be extended in a number of ways to reinforce tree structures and explore applications:
BRIDGES Team: Contact the BRIDGES team for any issues with the BRIDGES API. This is an active project.
K-D Tree Element documentation ColorGrid documentation Color documentation Bridges documentation
K-D Tree Element documentation ColorGrid documentation Color documentation Bridges class documentation
K-D Tree Element documentation ColorGrid documentation Color documentation Bridges documentation